 |
|||
|
|
|||
| ||||||||||
|
|  MIL-C-48868E (AR)
Add fresh 90% methanol to the square beaker. Grind this
solution in the polytron for 1 minute. Add to the filtering
apparatus. Repeat two times. Transfer the filtrate into a 250
ml volumetric flask. Make up to the mark with 90% methanol.
Shake the flask well enough to make sure the solution is
uniform. Using a pipet, transfer exactly 15 ml of this
solution into a 50 ml volumetric flask. Make up to mark with
90% Methanol. Shake well. Measure the absorbance of this
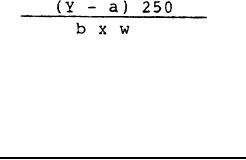
solution at 285 nm. Calculate the DPA content according to the
following formulas:
DPA
%
=
Where Y
=
Absorbance
a
=
Intercept of calibration curve
b
=
Slope of calibration curve
w
=
Sample weight in gms.
4.5.1.3.2.2 Calibration procedure. Dry approximately 1
gram of diphenylamine using the microwave moisture analyzer.
Weigh approximately 200 mg to the nearest 0.2 mg. Add this to
a 250 ml volumetric flask. Add 90% methanol solvent and dilute
to mark. Mix well.
Pipet 5 ml from the 250 ml flask and transfer to a 100 ml
volumetric flask. Dilute to mark using the same solvent and
mix well. This is the standard stock solution. Volumetrically
pipet the following aliquots of the standard solution into 100
ml volumetric flasks.
5 ml
Solution in a 100 ml volumetric flask = 0.002 mg/ml
10 ml
Solution in a 100 ml volumetric flask = 0.004 mg/ml
15 ml
Solution in a 100 ml volumetric flask = 0.006 mg/ml
Dilute all standard solutions to mark and mix well. Zero
the spectrophotometer with fresh 90% methanol solvent at
285 nm. Rinse the cell with the first standard twice, then
measure the absorbance.
Rinse the same cell with the second standard, then measure
its absorbance. Perform the same procedure with the third
standard.
Input the absorbance and concentration data points
into a linear regression program. Obtain the slope, yintercept
and r value (correlation coefficient). If r is less than 0.999,
the standard should be rerun.
19
|
|
Privacy Statement - Press Release - Copyright Information. - Contact Us |
