 |
|||
|
Page Title:
Table 1. Electrical performance characteristics-cont. |
|
||
| ||||||||||
|
| 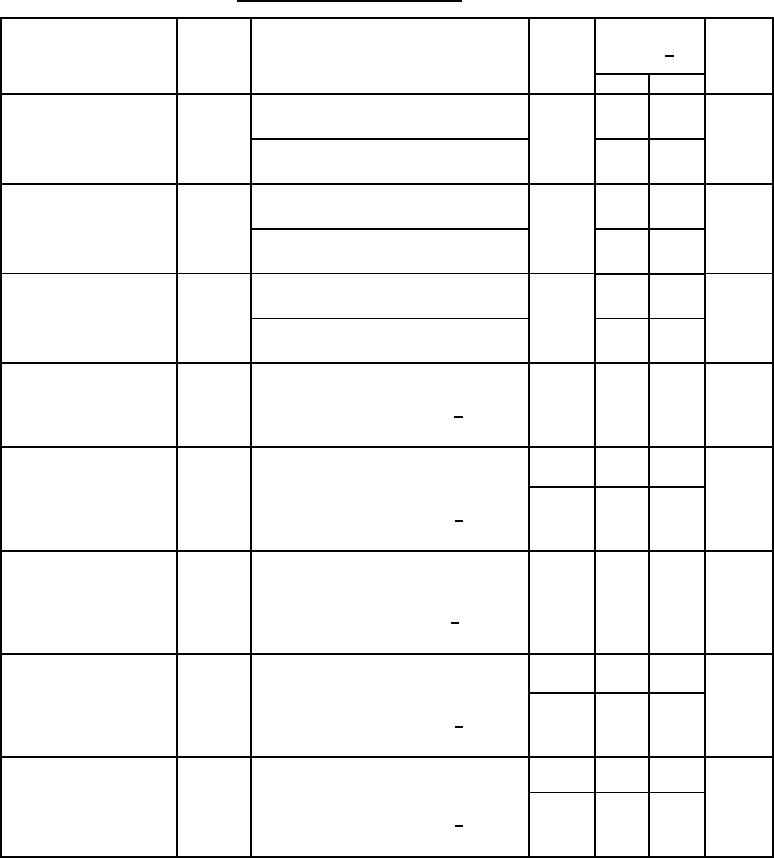 MIL-M-38510/140A
TABLE I. Electrical performance characteristics Continued.
Conditions
-55C ≤ TA ≤ +125C
Device
Limits 1/
Unit
Test
Symbol
type
unless otherwise specified
see 3.6 and figures 4 and 8
Min
Max
All
-1.0
1.0
LSB
Integral linearity error
(Abbreviated test), -55C ≤ TA ≤ +125C,
LE
figures 6 and 8
-0.5
0.5
(Abbreviated test), TA = +25C,
figures 6 and 8
Integral linearity error
All
-1.0
1.0
LSB
(All codes test), -55C ≤ TA ≤ +125C,
LE
figures 6 and 8
-0.5
0.5
(All codes test), TA = +25C,
figures 6 and 8
Differential linearity error
All
-0.9
2.0
LSB
(Abbreviated test), -55C ≤ TA ≤ +125C,
DLE
figures 6 and 8
-0.9
1.0
(Abbreviated test), TA = +25C,
figures 6 and 8
STS delay from CE
Low to high transition,
All
350
ns
tDSC
referenced to low to high CE transition,
output code = 0000 0000 0000 2/
TA = +25C, figures 7 and 8
Data access time from
Output data valid,
01,02,
200
ns
tDD
CE
referenced to low to high CE transition,
03,04
output code = 0000 0000 0000 and
05,06
250
1111 1111 1111 2/
TA = +25C, figures 7 and 8
Data valid after CE low
Output data valid,
All
25
ns
tHD
referenced to high to low CE transition,
output code = 0000 0000 0000 and
1111 1111 1111 2/
TA = +25C, figures 7 and 8
STS delay after data
High to low transition referenced to data
01,02,
300
1000
ns
tHS
valid
valid,
03,04
output code = 0000 0000 0000 and
05,06
100
600
1111 1111 1111 2/
TA = +25C, figures 7 and 8
Output delay to Hi-Z, referenced to high to
01,02
100
ns
Output float delay
tHL
low CE transition,
03,04,
150
output code = 0000 0000 0000 and
1111 1111 1111 2/
05,06
TA = +25C, figures 7 and 8
See footnotes at end of table.
10
|
|
Privacy Statement - Press Release - Copyright Information. - Contact Us |
